- Publications
- Data by Country
Explore Data of Countries
Find out how people in different countries around the world experience justice. What are the most serious problems people face? How are problems being resolved? Find out the answers to these and more.
*GP – general population; *HCs – host communities; IDPs* – internally displaced persons
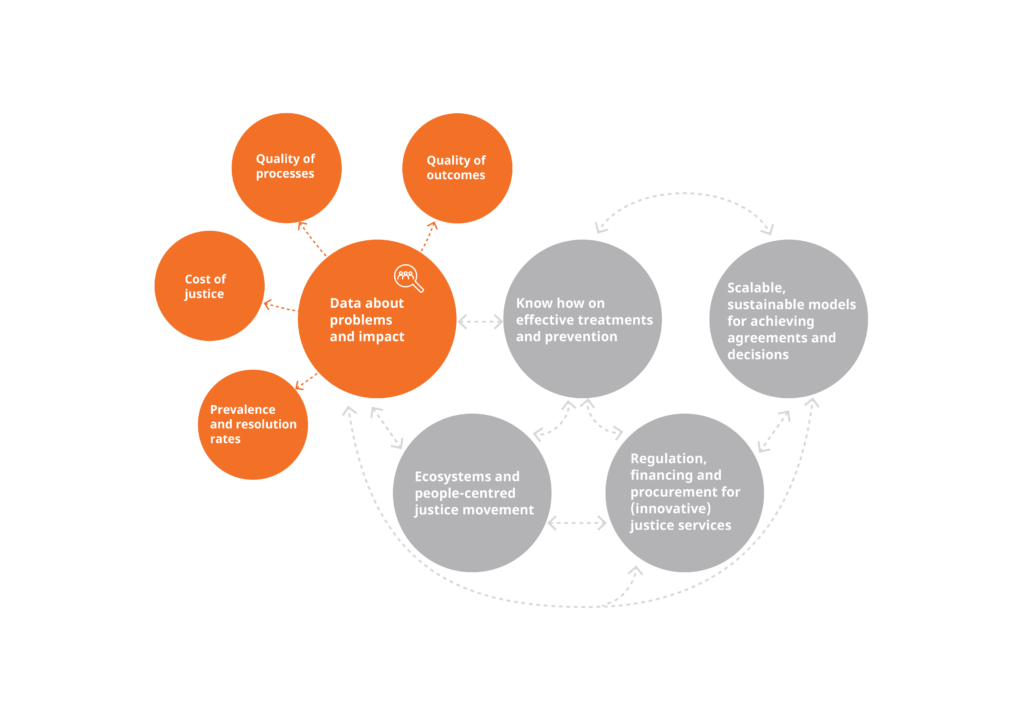
- Solving & PreventingPeople need good solutions to their justice issues. What do these solutions look like?
Explore guidelines for solving and preventing justice problems. They recommend interventions, which can support lawyers, paralegals and other practitioners in their work.
- Justice Services
Justice Services
Innovation is needed in the justice sector. What services are solving justice problems of people? Find out more about data on justice innovations.
The Gamechangers
The 7 most promising categories of justice innovations, that have the potential to increase access to justice for millions of people around the world.
Justice Innovation Labs
Explore solutions developed using design thinking methods for the justice needs of people in the Netherlands, Nigeria, Uganda and more.
- Enabling Environment
Creating an enabling regulatory and financial framework where innovations and new justice services develop
Rules of procedure, public-private partnerships, creative sourcing of justice services, and new sources of revenue and investments can help in creating an enabling regulatory and financial framework.
Forming a committed coalition of leaders
A committed group of leaders can drive change and innovation in justice systems and support the creation of an enabling environment.
- Problems
Problems
Find out how specific justice problems impact people, how their justice journeys look like, and more.